Building Torvix: An Open-Source Cloud Cost Intelligence Platform
Cloud bills are strange.
They are extremely important, but most teams only look at them after the damage is already done. A cost spike happens today, the bill becomes obvious later, and by the time someone starts investigating, the question is no longer just “how much did we spend?” but:
Where did this cost come from? Which account, compartment, region, service, or resource caused it? Was this expected growth, a misconfiguration, or pure waste?
That gap is what pushed me to build Torvix.
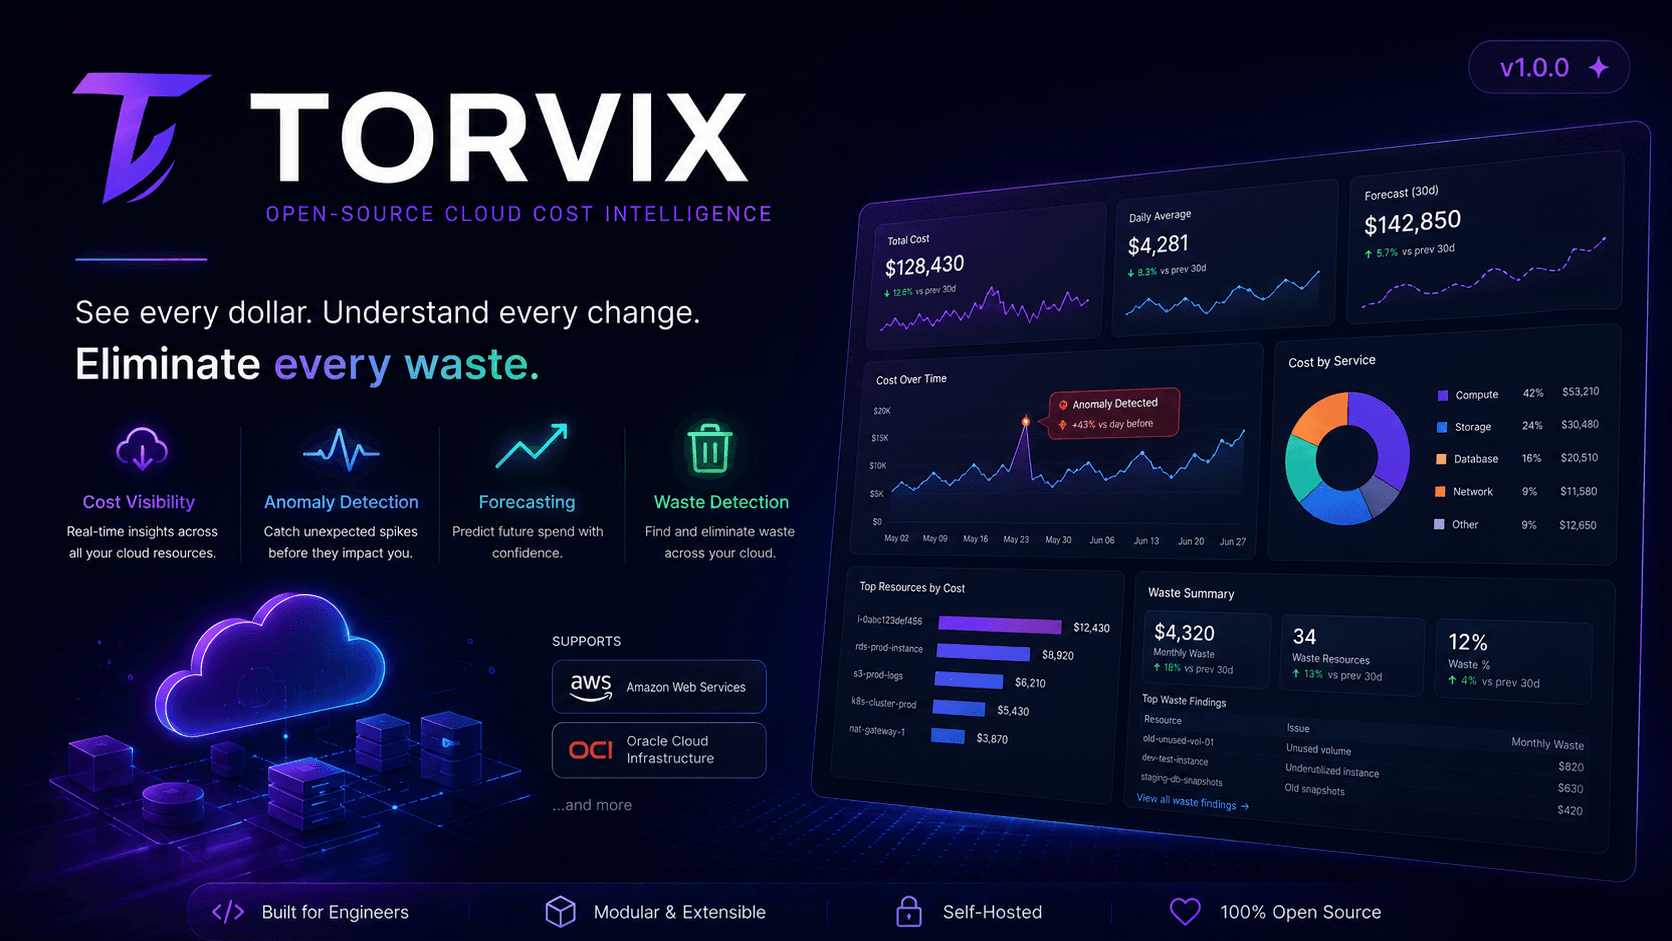
Torvix is an open-source cloud cost intelligence platform focused on cloud cost visibility, anomaly detection, forecasting, and unused-resource detection. The goal is not to replace every enterprise FinOps product. The goal is to give DevOps, SRE, platform, and infrastructure teams a practical, self-hosted way to understand their cloud spend using the tools they already trust: PostgreSQL, TimescaleDB, APIs, Prometheus, and Grafana.
How the idea came into my mind
The idea started from a very practical DevOps problem.
When you work with cloud infrastructure every day, cost is not a separate finance-only topic. It is connected to architecture, deployments, storage, networking, monitoring, idle resources, and sometimes even small mistakes that silently keep generating bills.
I wanted something that could answer operational questions like:
Which region is contributing the highest cost?
Which compartment or linked account is responsible?
Which service is driving the increase?
Is today’s spend normal compared to the last few days?
Are there unused resources still generating cost?
Can this be shown cleanly in Grafana without directly exposing the database?
Cloud providers already have billing dashboards, but they are usually provider-specific. For real infrastructure work, I wanted something more open, extensible, and operational: ingest billing exports, normalize them, precompute useful summaries, expose APIs, and let Grafana visualize the result.
That became Torvix.
What Torvix is today
Torvix is currently built as an operational FinOps platform, not a long-term billing warehouse. It focuses on recent, actionable cost data and tries to make that data easier to inspect, alert on, and explain.
The core idea is simple:
Cloud billing exports
        ↓
Torvix ingestion
        ↓
PostgreSQL + TimescaleDB
        ↓
Precomputed summaries, anomalies, forecasts
        ↓
Torvix API + Grafana dashboards
Instead of making Grafana query the database directly in production, Torvix exposes API endpoints that dashboards can consume safely. This keeps PostgreSQL private and makes the dashboard layer cleaner.

Current features
1. AWS and OCI cost ingestion
Torvix currently supports AWS and OCI.
For AWS, the preferred architecture is CUR 2.0 / Data Export through S3. Cost Explorer is still available as an optional mode for testing, debugging, or fallback, but the main direction is file-based billing export ingestion.
For OCI, Torvix reads proprietary OCI cost reports from Object Storage, handles CSV/gzip reports, tolerates schema drift through dynamic headers, and keeps row-level lookback filtering as the correctness boundary.
This means Torvix can support both cloud-native export pipelines and a normalized internal cost model.
2. Canonical multi-cloud normalization
Different clouds have different naming models.
OCI has compartments. AWS has linked accounts. Future providers may have projects, subscriptions, resource groups, folders, or other hierarchy models.
Torvix normalizes cost records into provider-neutral fields like billing scope, project, network scope, resource metadata, tags, record type, and source metadata. This makes it possible to build common dashboard APIs without pretending that all clouds behave exactly the same.
3. Precomputed daily, weekly, and monthly summaries
After ingestion, Torvix refreshes dashboard summary tables instead of calculating everything from raw records on every request.
It precomputes:
daily cost summaries
weekly cost summaries
monthly cost summaries
dashboard breakdowns
anomaly rows
forecast rows
This design keeps dashboard APIs fast and predictable.
4. Grafana dashboards
Torvix ships Grafana dashboards for:
AWS FinOps views
OCI FinOps views
waste detection views
The AWS dashboard follows:
Region → Account / Scope → Service
The OCI dashboard follows:
Region → Compartment → Service
This was an intentional design decision. Each cloud has its own naming and hierarchy model, so forcing everything into one generic drilldown would hide useful context.

5. Explainable anomaly detection
Torvix anomaly detection is intentionally deterministic and explainable.
It does not blindly call something “AI detected” just because a number changed. It compares daily spend against recent historical baselines and keeps the logic debuggable.
The current model is useful for questions like:
Did this service suddenly increase?
Is this region above its normal baseline?
Did a linked account or compartment behave unusually?
Is the change large enough to care about?
The important part is that operators can understand why a finding exists.
6. Forecasting
Torvix also computes a simple forecast using recent spend trends. The purpose is not to pretend to be a full financial planning system. The purpose is to give operators a quick signal of where spend may go if the current pattern continues.
For many teams, even this simple forecast is useful because it brings cost awareness closer to daily operations.
7. OCI waste detection
Torvix includes Phase 1 waste detection for OCI.
Current OCI rules include:
detached block volumes
detached boot volumes
stopped compute instances with paid storage
unused reserved public IPs
This feature is recommendation-only. Torvix does not delete, stop, resize, retag, or modify any resource. It creates findings so humans can review and act.
That distinction is important. Cost optimization tooling should be safe by default.
8. Waste findings API
Waste detection is exposed through APIs for:
summary
findings
individual finding details
rules
status updates
Findings can be filtered by provider, region, scope, service, resource type, rule, severity, status, confidence, and estimated monthly waste.
This makes it easier to build dashboards, reports, or even custom workflows around waste review.
9. Optional AI explanations
Torvix has optional AI enrichment for anomaly and waste findings.
The important design principle is that AI does not create findings, change severity, resolve findings, or perform remediation. The deterministic engine creates the finding. AI can optionally explain the finding in a more readable way.
By default, sensitive identifiers such as account IDs, compartment IDs, resource IDs, and resource names can be excluded from model input. That keeps the feature practical while still being safer for real-world environments.
10. API authentication
Torvix supports bearer-token authentication for API endpoints.
When API auth is enabled, endpoints are protected except health checks and Swagger documentation. This matters because cost data can reveal sensitive infrastructure details.
11. Scheduler, reporting, and alerting
Torvix includes an in-process scheduler for ingestion and report delivery.
It can run scheduled ingestion, generate daily/weekly/monthly report windows, and send notifications through configured alerting targets. This makes it useful as a continuously running service instead of a one-time CLI script.
12. Production hardening
Before the first major release, I focused heavily on hardening:
CI workflow for tests and builds
Compose validation
Swagger validation
vulnerability scanning with
govulnchecknon-root container runtime
Docker image hardening
JSON subsystem logging
optional stdout log mirroring
health checks
version exposure through
/healthzApache-2.0 licensing metadata
This was important because a FinOps platform should not just work locally. It should be safe enough to run near production billing data.
The first major release
The first major release of Torvix is v1.0.0.
For me, this release is not about saying “everything is finished.” It is about saying the foundation is now clear enough to be used, tested, improved, and extended.
The v1.0.0 release includes the major building blocks:
AWS CUR/Data Export ingestion
optional AWS Cost Explorer mode
OCI billing export ingestion
PostgreSQL + TimescaleDB storage
precomputed cost summaries
anomaly detection
forecasting
Grafana dashboards
OCI waste detection
API endpoints
bearer auth
scheduler and reporting
optional AI explanations
production-oriented hardening
The most important part of this release is the architecture. Torvix now has a provider-aware but provider-neutral foundation. That means future providers and deeper resource attribution can be added without rewriting the entire platform.
What I learned while building it
Building Torvix made one thing very clear: cloud cost intelligence is not just about parsing billing files.
The hard parts are in the details:
avoiding duplicate billing records
handling delayed reports
dealing with provider-specific schemas
keeping dashboards fast
avoiding double-counting
deciding what should be precomputed
making anomaly detection explainable
keeping credentials and APIs secure
designing drilldowns that match each cloud provider’s reality
making waste detection useful but non-destructive
A cost dashboard is easy to demo. A reliable cost intelligence pipeline is harder.
Future plans and enhancements
Torvix is still evolving. Some of the major roadmap items I want to work on next are:
1. AWS waste detection
OCI waste detection is already implemented in Phase 1. AWS waste detection is the next major step.
Planned AWS rules include:
stopped or idle EC2 instances
unattached EBS volumes
unused Elastic IPs
idle load balancers
idle RDS databases
CloudWatch utilization based checks
tag-based exclusions
multi-account and multi-region scanning
2. Deeper AWS attribution
AWS cost attribution can get complicated because not every service maps neatly to a VPC or resource.
Future work can improve attribution using:
tags
cost categories
account mappings
project mappings
inventory enrichment
VPC-to-project mapping where applicable
The goal is to move beyond account-level visibility and get closer to resource-level accountability.
3. Parquet support for AWS exports
Current AWS export support focuses on CSV and CSV gzip. Parquet support is planned because many billing export workflows prefer it for efficiency and scale.
4. Azure and GCP support
Torvix currently exposes implemented providers only: AWS and OCI.
Azure and GCP support are natural future additions, but I want to add them properly instead of leaving half-built provider scaffolding. Each provider has its own billing model, hierarchy, and terminology, so the implementation should respect that.
5. Better anomaly tuning
The current anomaly model is deterministic and explainable. Future improvements can include:
configurable thresholds
per-provider tuning
per-service sensitivity
better false-positive controls
richer anomaly explanations
seasonality-aware baselines
The priority will remain explainability.
6. Better reporting workflows
Daily, weekly, and monthly reporting can become more useful with:
richer report templates
provider-specific report sections
top movers
top waste findings
anomaly summary
forecast summary
Slack/Teams/Discord/email friendly formats
7. More dashboards and drilldowns
Grafana is already a strong visualization layer for Torvix. Future dashboards can add:
cost movement views
service-level trend analysis
resource-level cost views
waste trend over time
anomaly history
provider comparison
forecast vs actual views
Why open source?
I wanted Torvix to be open source because cloud cost visibility should not be locked behind expensive tooling only.
Many engineers, small teams, startups, and self-hosted infrastructure users need practical FinOps visibility, but they may not need or afford a large enterprise platform. An open-source foundation allows people to inspect how the system works, self-host it, modify it, and contribute provider-specific improvements.
Also, for infrastructure tooling, transparency matters. If a tool is analyzing billing data and recommending cost actions, users should be able to understand the logic.
Final thoughts
Torvix started as a practical DevOps pain point: cloud cost data exists, but it is often not operational enough.
I wanted a system that could ingest billing exports, normalize cost records, detect anomalies, forecast spend, identify waste, and expose everything through APIs and Grafana dashboards.
The first major release is just the beginning.
There is still a lot to improve, especially around AWS waste detection, resource-level attribution, Azure/GCP support, richer reporting, and better anomaly tuning. But the foundation is now in place.
Torvix is my attempt to build a simple, open, self-hosted cloud cost intelligence platform for engineers who want to understand not just how much they spent, but why they spent it.